
Measuring ≠ Learning
Hey Ant here 👋 I write a newsletter that won't go viral - and that's the point.
Because hot takes, clickbait and AI slop won't help you ship better products. But practical content grounded in real work will - the kind I do every day on my own products and the product leaders I coach.
Join 15,000+ product people who subscribe. Same applies to my YouTube channel!
Recent posts you might have missed:
- The Most Demanding Role in Product
- Exploring vs Exploiting: The Two Modes of Product Discovery
- Prioritization Happens In Layers
Quick announcement: I’m running two free events this month:
Platform Product Management Masterclass (TOMORROW!)
Claude Design vs Figma Make vs Paper vs Pencil: Which AI design tool is best? (22nd July)
Platform PM one is tomorrow, we’ve already got 200 registered! Hope to see you there.
Why metrics like MAU (monthly active users) fail - and the techniques I use to define product metrics that actually drive decisions.Here's the problem with those "ultimate list of product metrics" and posts on "5 metrics startups MUST track"
Is that you end up tracking metrics without fully understanding why or how they interplay and impact your product.
Metrics then become either noise - tacking 50 different metrics but no idea what half of them are telling you - or a checkbox activity.
Here's a real example to illustrate what I mean.
I was coaching a Product Manager at a startup a while back who asked how they could increase MAU (monthly active users). Their founder had decided MAU was going to be their North Star metric.
Which sounds reasonable on paper. MAU is a widely used metric - no doubt one you’ll find in those types of posts!
But when I asked what they were trying to learn from MAU, she paused.
I reframed the question: "What actions do you expect users to take on a monthly basis that make this a good north star?"
Her answer: "I guess none. Because we wouldn't want users changing policies too often, and a lot of claims means something went wrong."
For context, they were an insurance startup. And I'm not sure about you, but I'm not opening my insurance app every second day.
Now, I could imagine a strategy where MAU makes sense for an insurer. Something like: You only ever deal with your insurance provider when something's gone wrong, so it's not a pleasant relationship - we're going to change that by giving you a positive moment with us every month.
But that wasn't the case.
The founder had decided that MAU was the metric (probably from reading one of those posts!)

Every product metric should answer two questions
Two of my favourite questions to ask about any product metric are:
What are you trying to learn?
What change will you make as a result?
There are thousands of things you can measure, but measuring for measurement's sake isn't helpful. It needs to drive decisions.
More often than not when I coach teams, they can muster a vague answer to the first question. But the second question is where things get practical.
Build-Measure-Learn only works when your measure leads to learning - and learning leads to action.
Going back to the MAU example. If it dropped 10% this week, what would you do?
If the answer is nothing, why are you tracking it? What's the purpose?
I love these two questions because they cut through the noise.
I couldn't tell you how many product teams I've seen with vast dashboards and long lists of 'success metrics' but take no action when the numbers move.
I’m sure you’ve seen it too.
Productivity dashboards with story points, burndowns, capacity, tickets closed.
Dashboards filled with vanity like impressions, sign ups, downloads, etc.
All sitting there gathering dust, occasionally making their way into a slide deck but no action being taken.
And don’t get me wrong, it’s important to have good instrumentation and a wide coverage but every metric competes for your attention. Too many and you simply start to ignore them.
So unless it’s helping you drive a decision, you’re probably adding more noise than signal.
Start with the problem, not the metric
Most teams run this backwards. They open the analytics tool, look at what's already instrumented - DAU, sessions, page views - and pick from the menu of metrics.
It's then no surprise that the metrics don't connect to anything, and nobody can answer those two questions above.
There are two patterns I see:
The metrics come at the end. They're generic and don't tell you anything meaningful.
We default to what's easy to measure, not what's important.
Good metrics don't start with the solution or the measurement. They start with understanding the problem.
If you're clear on the problem you're trying to solve and therefore the change in user behaviour you expect to see as a result. Then defining success metrics should be relatively straightforward.
You simply need to ask yourself; how might we measure that change in customer behaviour? Or How will we know the problem has been solved?
And you should be able to define these upfront, in discovery and not wait until the last minute to slap together a slide on 'success metrics'.
A metal model I find helpful here is breaking outcomes down into Business > Product > and User outcomes.
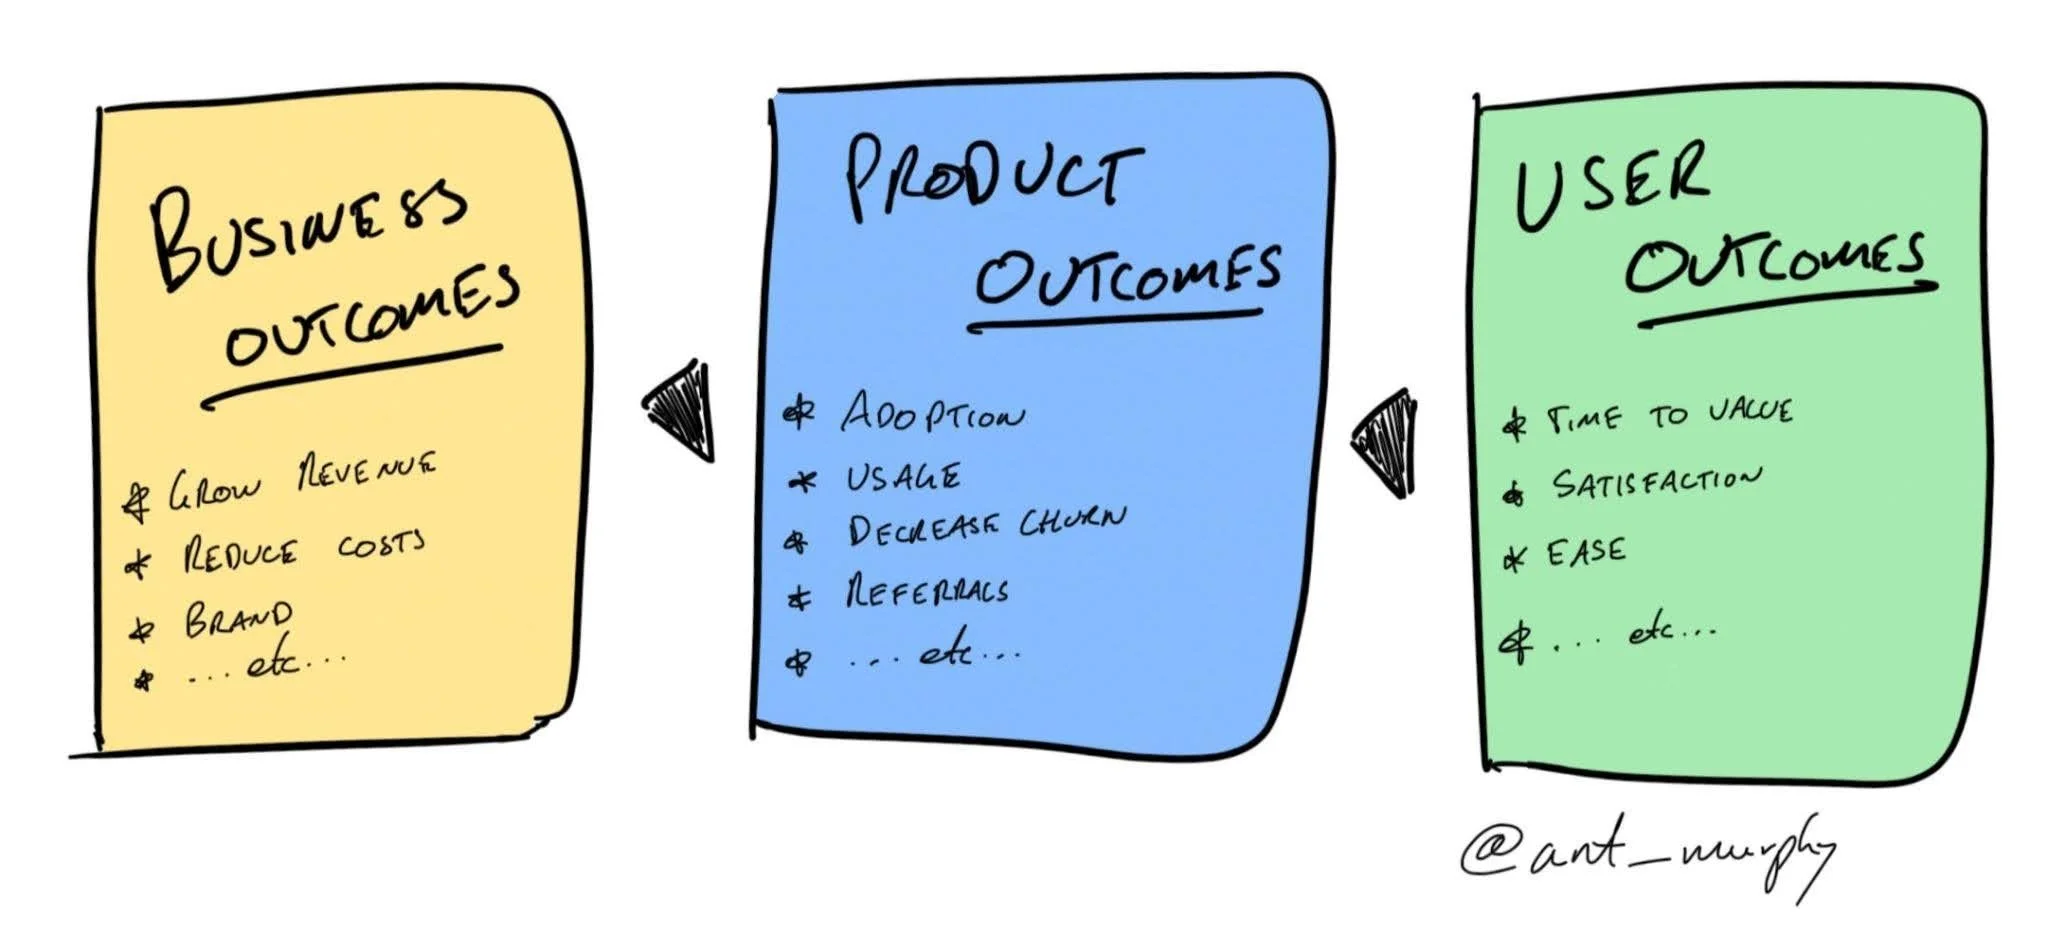
Following that chain, you should be able to define:
Business metrics = the business impact you hope the new feature or product will have
Product metrics = the product outcomes you hope to achieve with it
User metrics = the change in user behaviour you expect to see as a result
Vanity vs actionable metrics
Eric Ries, in The Lean Startup, frames this distinction as vanity metrics vs actionable metrics.
A vanity metric tells you what already happened, in a way that makes you feel good.
E.g. total registered users. Total downloads. Page views.
An actionable metric tells you what to do next.
E.g. conversion of new sign-ups to active users. Time-to-first-value. Activation rate per cohort.
This is one of the reasons I don't track metrics like 'impressions' on my own content. It's a vanity metric.
Sure, it feels good to watch that number climb (and it's the biggest number! Who doesn't love a bit of inflation). But it doesn't tell me whether people got value from the content, or whether they took action as a result (followed, subscribed, bought something).
It just boosts your ego. That's it.
Instead I measure things like:
Repeat purchase: how many customers renew/return? This includes my newsletter and live streams. E.g. How many re-subscribe when they change jobs, or attend more than one webinar?
Reads-to-subscriber ratio: how much a newsletter post gets shared, and how many of those readers then subscribe?
Engagement: how many reposts, shares, replies and comments do I get per piece of content (newsletter, YouTube video, post)?
Time to purchase: how long has someone been a subscriber, or engaged with my content, before they join the Product Mentorship or a course?
What you'll notice is that all of these are specific and contextual.
With every one, I'm trying to measure a specific behaviour that I believe drives an outcome. In this case, they all measure value exchange in some shape or form.
Repeat purchase is a lens on retention, but it's more specific. I care more about how many newsletter posts you've read than how long you've been a subscriber. Plenty of people churn into silent subscribers. It's why the industry average open rate sits around ~35%, and why open rate is a metric I track and work to keep close to 50%.

Claude Code reviewing my newsletter stats.
And the reads-to-subscriber ratio and engagement tell me how valuable the content is and how much impact it's had on your day-to-day.
Of course, I can't measure the outcome it had on you directly but I consider people reposting, commenting, or simply replying telling me it helped as good proxies.
When the metric that matters is hard to measure
There's a 1956 paper by V.F. Ridgway called "Dysfunctional Consequences of Performance Measurements" that warns that measuring what's easy tends to crowd out what actually matters.
I see this all the time with product teams, and it's another trap of the "Ultimate Product Metrics List" - the things that are easy to measure rarely tell you what you actually need to know.
We just went through a few with my own metrics:
Subscribers? = great, but how many are actually reading?
Reads? = great, you read it but was it actually valuable? or did you close it thinking "well that wasn't helpful"?
Measuring something like reads-to-subscriber ratio isn't easy. It would be much easier to stick with open rates and subscriber counts but they’re not meaningful.
And this is where teams get stuck.
They throw in the towel or look for the path with the least friction.
And that’s the trap that Ridgway was describing all those years ago and it’s still relevant today.
So I see friction as a good sign - it means the metric is:
Unique: specific to your product and your problem, not pulled off the analytics shelf
Meaningful: tied to the behaviour change you actually care about
And thought through: you've actually unpacked what you're trying to learn
So it's worth pushing through the friction. I'll take a meaningful proxy, or a smaller sample of something high-quality, over a generic metric every time.
Side note: AI can help
Believe it or not, AI has been a huge unlock here. I've been able to stitch together metrics I simply couldn't before.
Because I can now pull multiple data sources in different formats, from different tools all into one central spot and get AI to normalise and connect the dots.
Take 'time to purchase'. That single number lives across three different systems: my newsletter platform, my payment provider, and my content analytics. No single tool will ever report it for me. Now it's part of a monthly report I don't even build by hand.
Which if you’re interested in more on how I do this, I gave a bit of a sneak peek into how I'm doing this in a recent live stream.
Be specific
Once you know what to measure, there's one more tip that’s worth mentioning that I see product teams miss all the time.
You’ve got to be specific about what the metric is (and isn’t) and how you intend to measure it.
For example, a Product Manager I was working with was trying to define how long it takes users to complete a certain task.
His hypothesis was that time could be a proxy for difficulty and how good/bad the experience was.
Makes sense but the devil's in the details.
Do you start timing when the page loads? That is, time from page loaded to action completed.
Or do you start the clock once the user does something? Only tracking from their first action.
And these are important nuances:
The page might load while the user is distracted, or reading first.
But equally, time-to-first-action might be a good proxy for poor usability on its own. A confusing or overwhelming page will make it hard to work out what to do. So perhaps that’s worth tracking too?
But you can see we’re talking about the same metric "completion time” but we’ve got two different definitions that might tell very different stories.
If you’re wondering, in the end we decided to track both. Both time to first action and then the overall time to completion so we can unpack the differences between the two.
But this was only possible by going through this activity. By asking those two questions I shared at the start- being clear on what we were trying to learn and the expected change in user behaviour as a result.
So how we track it and what that does vs doesn’t tell us is just as important!
Making this actionable
If you want to put all of this into practice, I’d recommend running a quick audit. Take the key metrics that you’re tracking and see if you can answer:
What are we trying to learn from this metric?
What change will you make as a result? In other words, what decision(s) does it drive?
What's the threshold for action? What number triggers a conversation, an experiment, or a pivot?
If you stopped looking at this metric tomorrow, what would it change? If the answer is "nothing", delete it.
Metrics at the end of the day are tools.
And we should treat them that way.
If a metric isn't helping you learn, or prompting you to act differently, it's not doing its job. Get rid of it.
Start with what you want to learn, then define how you'll measure it. That's how you get metrics that give you real insight.
Hope that helps.
I’ve been doing a fractional role of late (building AI agents for a client. Not my usual engagement but it’s been very revealing about the realities on the ground and outside of the bubble) But for that role, I just went through this activity defining my own metrics so putting this all into practice made me think it was worth packaging up!
If this was helpful or resonated, forward it to a PM or product leader who could do with reading this.
And as usual, any questions hit reply, it comes straight to me.
/Ant
P.s. Reminder I’m running two free events this month:

1. Platform Product Management Masterclass
Platform Product Management is arguably the most demanding role in product. You've got to learn to adapt a lot of your product skills to the unique context.
In this live stream I'll share everything I've learned about doing Platform PM well.
Covering:
How to do discovery when you have end-users and internal teams
Internal pilots, launch and rollout for platforms
Approaching versioning and backwards compatibility without creating hard-dependencies
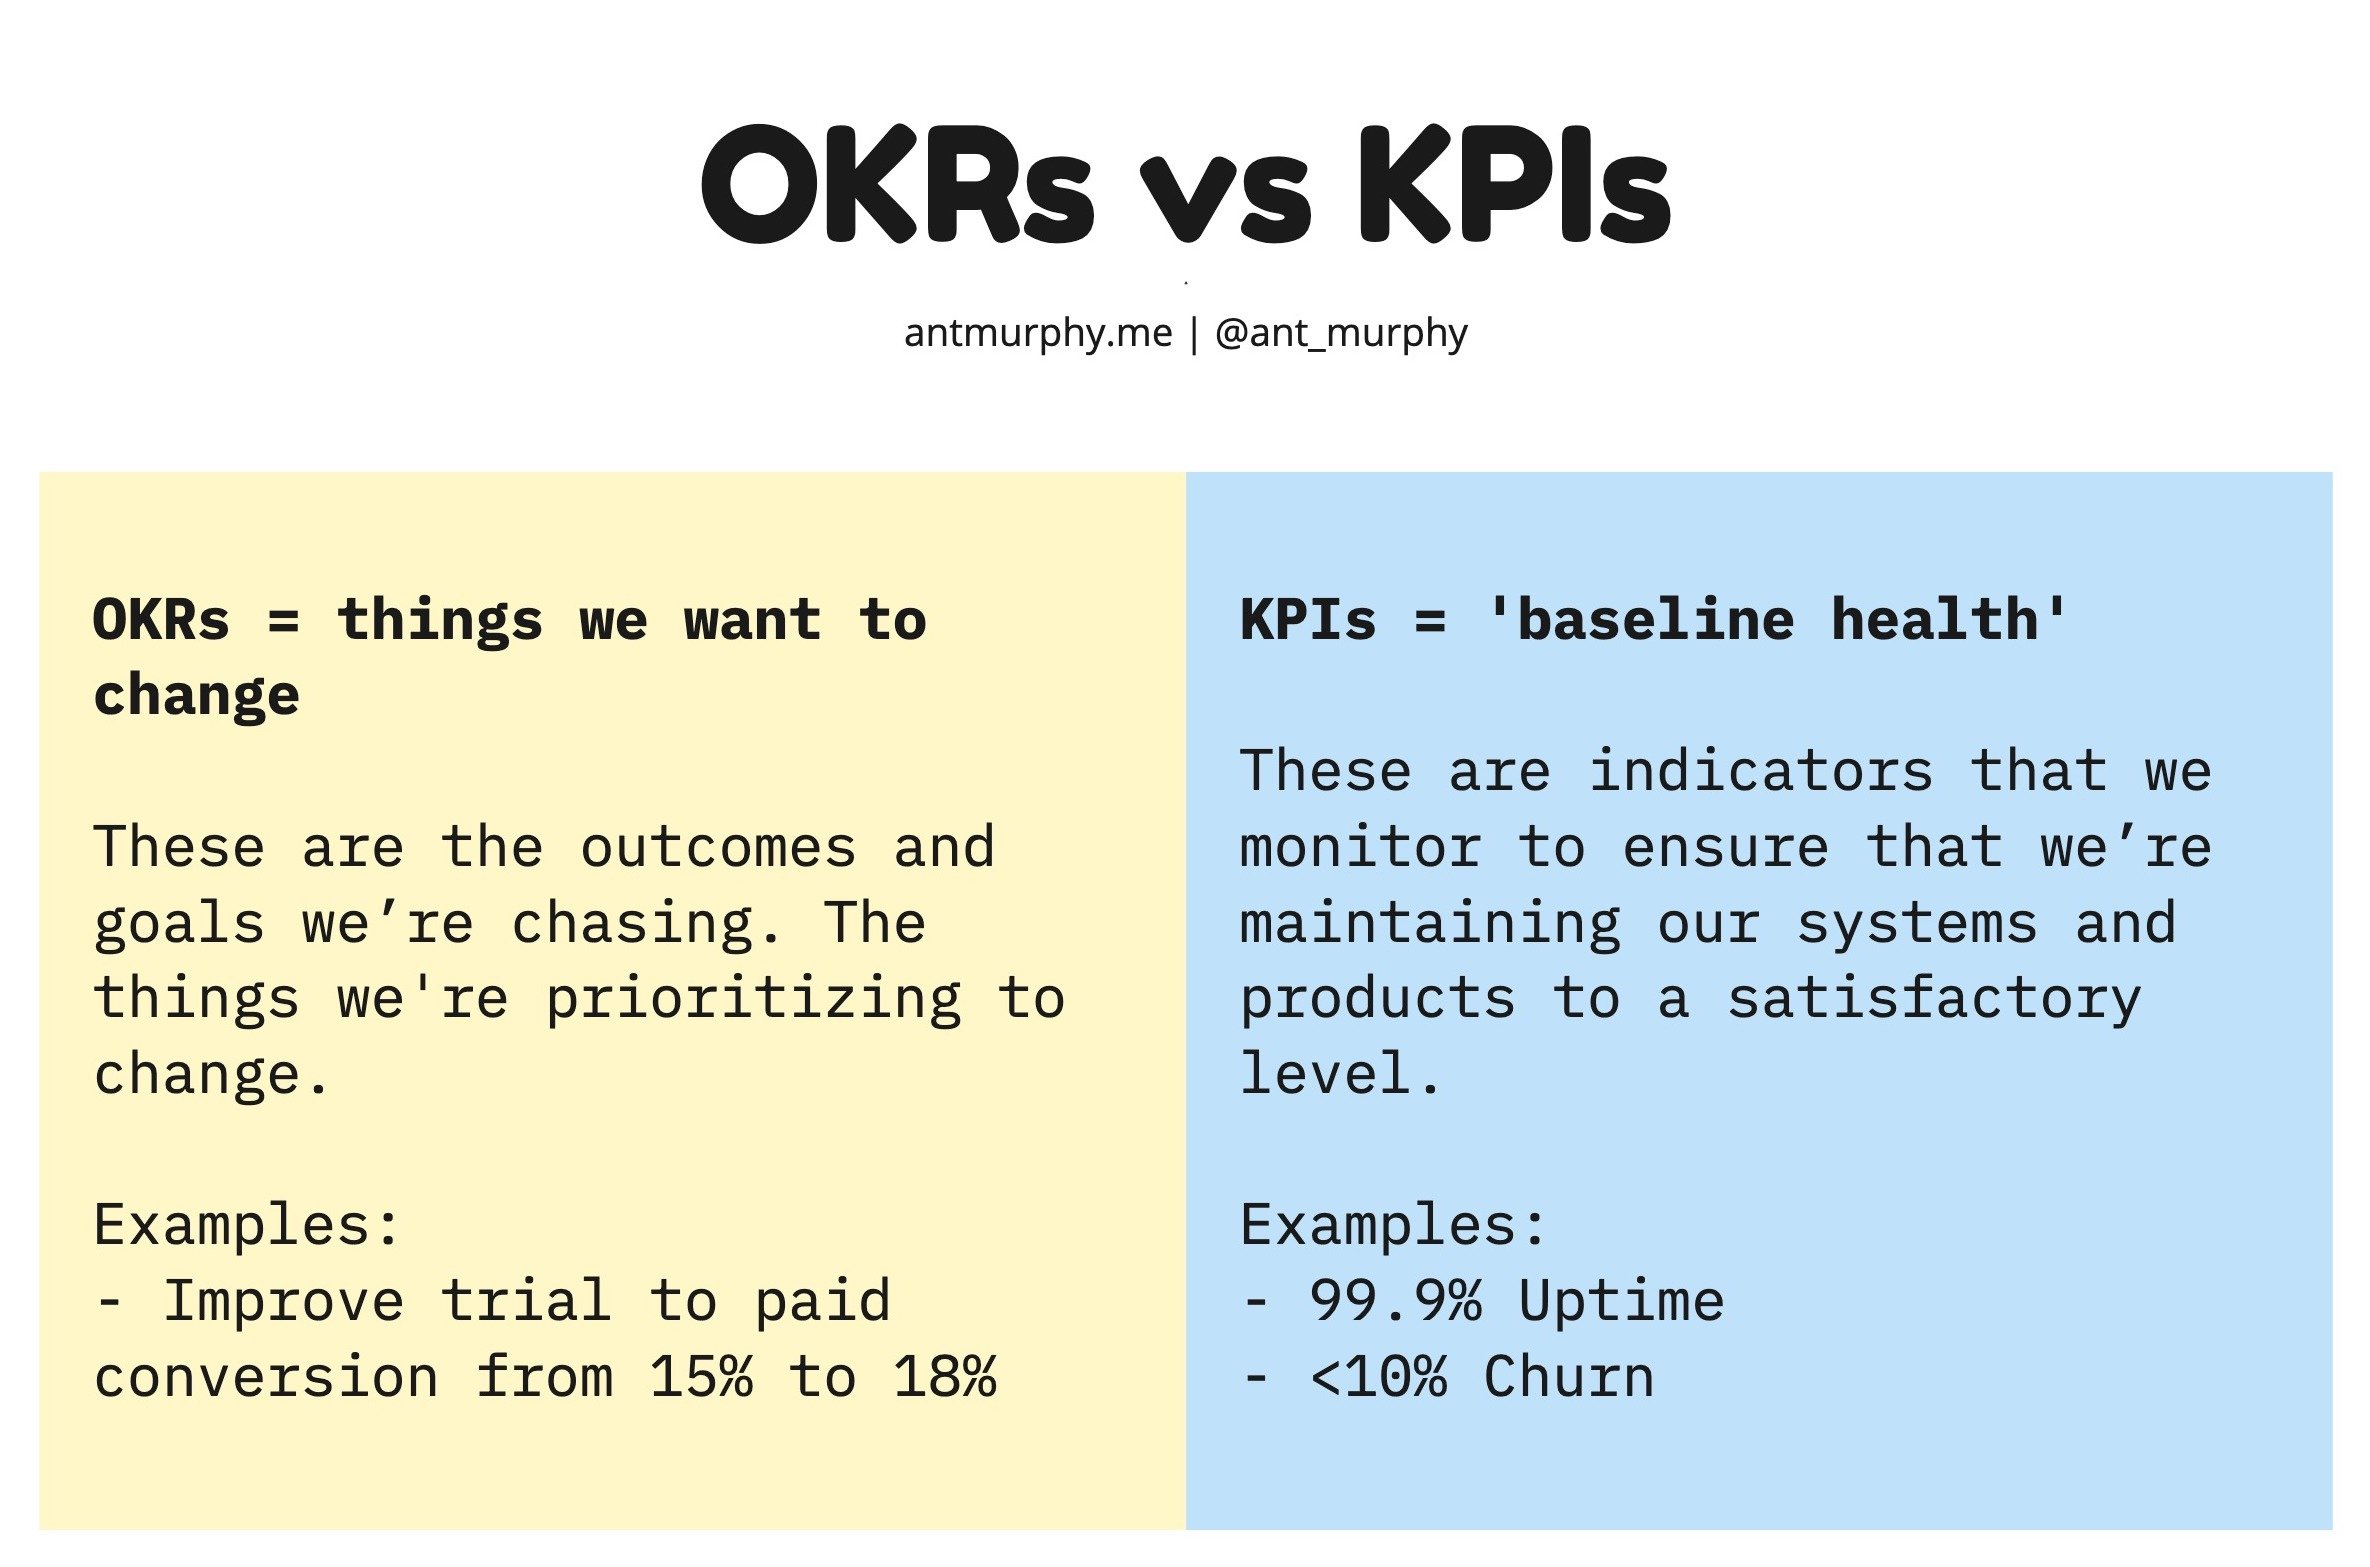
How to measure impact and set OKRs
Stakeholder Management and communication for platforms
Storytelling when the work is invisible
Plus live Q&A — bring me your hardest platform questions!
Join 150+ product people who have already registered here 🚀

2. AI Design Tools: Claude Design vs Figma Make vs Pencil vs Paper
For the last 6 months I’ve been using several new AI design tools - Claude Design, Figma Make, Pencil and Paper - and I wanted to share my experiences with them.
In this live stream we’re going to put these AI design tools head-to-head.
I’ll also share the pros and cons of each tool and where I think design is heading in the AI era.
Why talk about design tools for Product Managers?
Because roles are collapsing. PMs are starting to design. Designers are starting to code. Engineers are stepping up to set direction and shape the product. The lines between who does what are disappearing fast and you never know, these tools might be part of your job one day.
So whether you’re a designer, PM, or founder already dabbling with AI — or just curious how far these tools have actually come — this one’s for you!

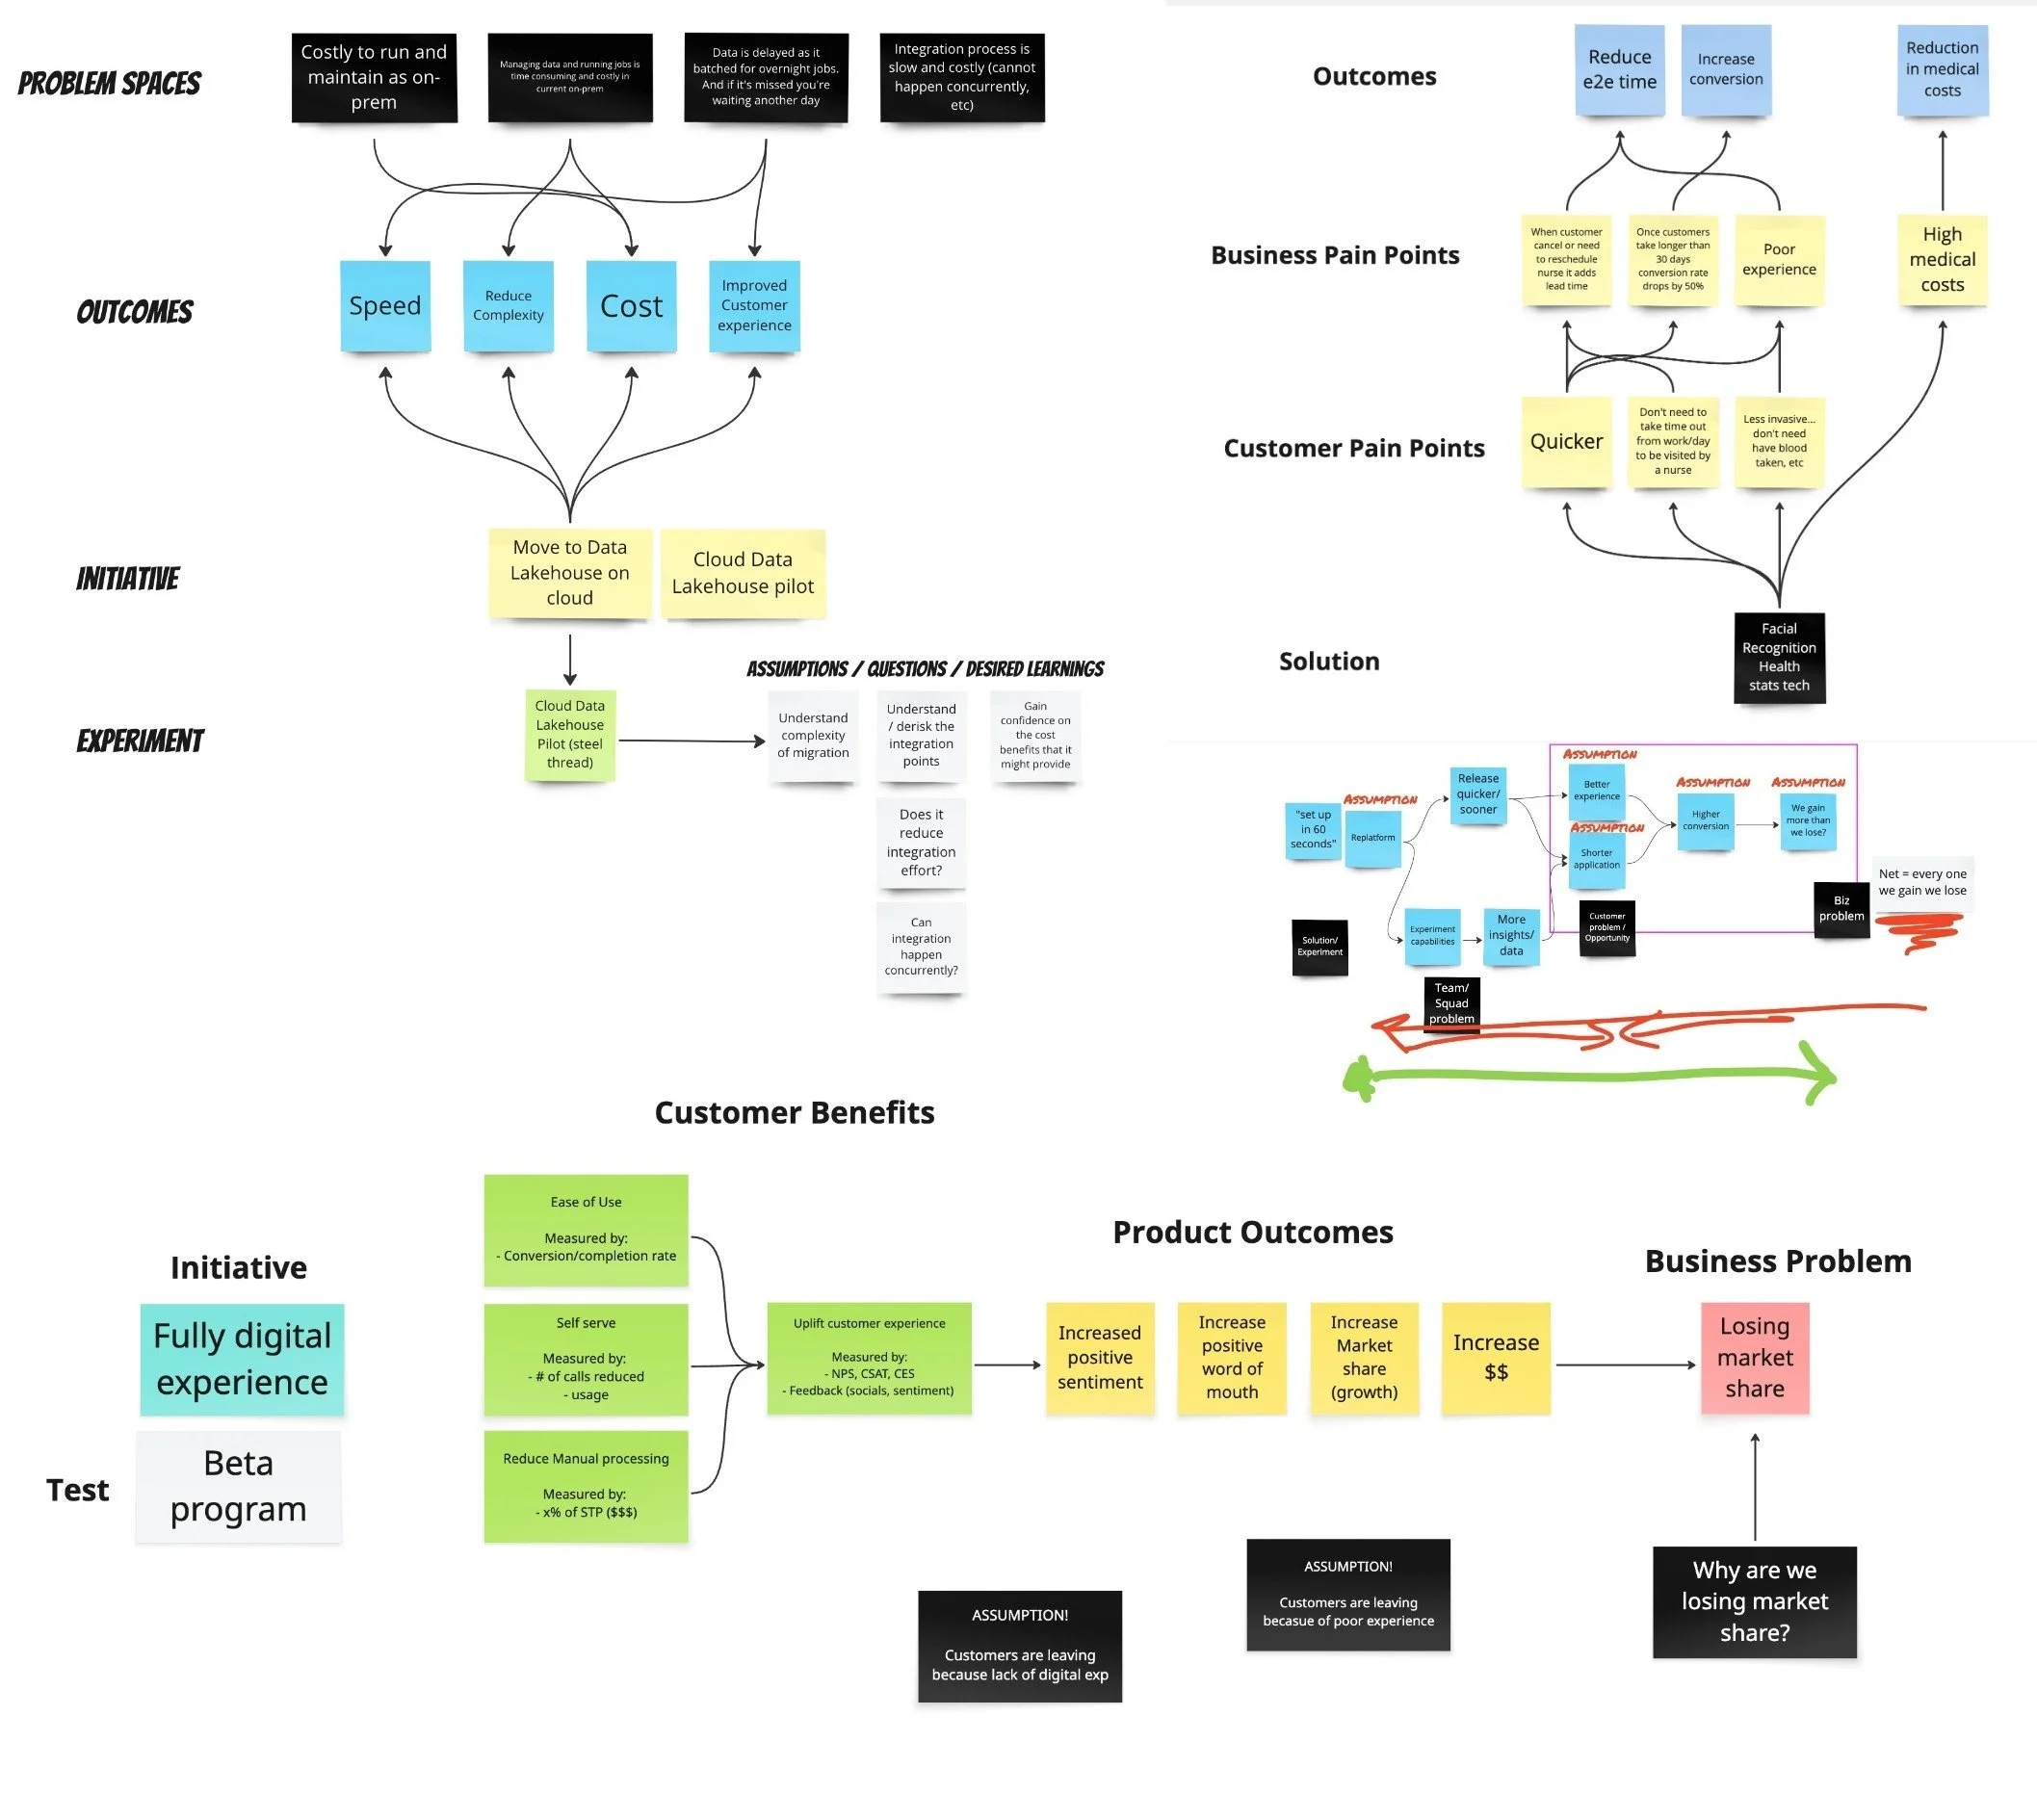








Your OKRs don’t live in a vacuum.
Yet this is exactly how I see many organizations treat their OKRs.
They jump on the bandwagon and create OKRs void of any context.
Here’s what I see all the time…